
Waging WAR: MLB Player Valuation Using Advanced Metrics
Introduction
Baseball players are constantly evaluated on their performance by raw statistics. In recent years, more advanced statistics have identified true value in baseball players while highlight raw statistics that actually contribute wins for the team. Our project leverages one of these statistics, Wins Above Replacement (WAR) in order to estimate the true dollar amount of baseball players. We then use this to help identify undervalued players, ripe for contract bids. This is what management really wants to see: identification of low hanging fruit that provides the most value for the team. The following paper outlines our modeling technique and development of our Salary Arbitrage Index (SAI) which identifies severely undervalued players who will potentially provide the highest value in the MLB.
Data & Metrics
Baseball may have very well been the pioneer of using different types of metrics in order to evaluate player performance dating back to Henry Chadwick in the 19th century. RBI, ERA, BA and BB are just a few simple metrics used today to evaluate players. However Baseball’s metrics can also be a double edged sword. With so many metrics it is difficult to definitively determine the value of one player in comparison to another. For example, this year’s NL CY Young Award has three amazing pitchers who are arguably the “best” pitcher deserving of that award. Zack Greinke, Clayton Kershaw, and Jake Arrieta who could all arguably be deserving of the award depending on which metric is evaluated. Arrieta currently has the most wins, two shut-outs and a no hitter. Kershaw has the most strikeouts and innings played. Greinke in the meantime has the lowest ERA. Adding FIB and WHIP Metrics makes the decision even harder. By evaluating Wins Above Replacement (WAR) we are able to evaluate and compare players consistently.
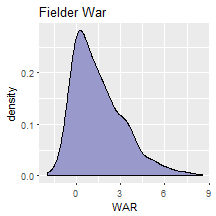
At the end of the day the most valuable aspect of a player is how many wins he contributes to team. We can take it a step further and say the most important metric is how many wins a player contributes to a team compared to the average player that could potentially replace him. One of the best aspects of the WAR metric is that it is a composite metric made of 6 different components measuring each individual player’s contribution to team wins. These components are:
- Batting Runs
- Baserunning Runs
- Runs added or lost due to Grounding into Double Plays in DP situations
- Fielding Runs
- Positional Adjustment Runs
- Replacement level Runs ( Based on playing time)
These components are centered on the principle that runs scored lead to wins, for position players. Pitchers are also included in the WAR metric as hitters and base runners. However there exists a separate WAR metric for pitchers that is centered on Runs Allowed adjusting to what an average pitcher would have done in the same situation. However, the small nuances in the pitcher WAR metric vary by source. Our data comes from Baseball-refernce.com who calculate what the average replacement pitcher would have done by controlling for elements such as the park that is being pitched in and the quality of the defense behind the pitcher. Fangraphs.com on the other hand uses FIP (Fielding Independent Pitching) to evaluate pitchers. However Fangraphs data was not freely available. The difference in the metric by source is small. For example fangraphs.com has Kershaw with the best WAR while baseball-reference.com has Grienke as the pitcher with the higher WAR. However in both cases those pitchers are just one or two spots away from each other in the rankings. We would side with baseball-reference.com since Grienke has the most wins.
In any case, our model goes beyond just WAR. As Economists we believe that value in terms of dollars and contract amounts is also important to the valuation of a player. These are the key components use in our analytic model.
Model & Methodology
For our analysis, we choose to use a linear regression so that we may estimate the true worth of a player on a continuous basis. Our predicted player salaries will then inform how much of an arbitrage opportunity their might be for a given player so that a team may appropriately bid for new talent. To begin our analysis, we decided to limit the scope of player performance to the last 5 seasons (2010 - 2014). This still allows us to leverage 145,109 player - year observations but also removes any bias due to inflation in salaries or drastic changes in performance over long careers. Our analysis also removes players earning the rookie minimum salary in 2010 ($400,000) since it heavily skews the salary distribution and results in poor model fit. We also choose to stratify our analysis by analyzing pitchers separate from fielders. It is common knowledge that pitchers help teams produce wins in a different way than fielders. Simply put, fielders derive most of their value from scoring runs whereas pitchers derive most of their value from preventing runs. We also use this as an opportunity to utilize a pitcher specific WAR in our analysis as it is a better indicator of pitching performance.
The data we use for analysis is a collapsed version of Baseball Reference’s Batting data and Pitching data. We do this in order to simplify the analysis and remove any potential for serial correlation. Since we wish to emphasize the current state of players, while still leveraging data on the performance in recent seasons, we summarize certain variables in the following manner:
-
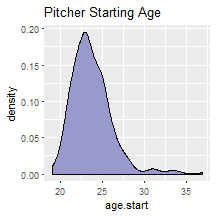
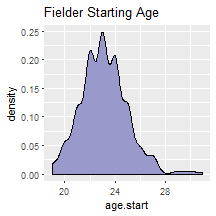
We take player age as of the 2014 season to provide the most recent years of experience.
-
We take player salary as of 2014 so that our final index is up to date.
-
We use a player’s median WAR score over the 5 year sample to identify the typical WAR score for players. This will prevent one-year wonders from biasing our estimates and emphasizes consistency in performance.
An examination of the variables used in the models reveals that most are not extremely skewed. This is not really an issue anyways since only the standard errors need to be normally distributed. However, we decide to take the logarithm of our outcome variable, salary, in order to provide better fit for the model at lower salaries and provide relatively intuitive coefficient interpretations.
For consistency, we specified the same variables for both the pitching and fielding models using the following model specification:
Log(Salary)_i = a+ beta_1WAR_i + beta_2Experience_i + beta_3(Experience_i)^2 + beta_4Age Start_i + epsilon_i
The independent variable is the log of the player’s 2014 salary. beta_1 is the coefficient on WAR’s impact on a player’s salary on average. beta_2 allows salary to increase as a players experience (the difference in years between their age in 2014 and the age they began playing in the MLB) and beta_3 allows decreasing returns to salary as a player ages. Ultimately, this models a function that may exhibit a decreasing salary as a player grows older in the latter years of their career. beta_4 is the coefficient on the age at which a player enters the MLB, which makes our experience estimates conditional on the age at which they began gaining MLB experience. The first model we ran was on fielder players only:
| | Estimate| Std. Error| t value| Pr(>|t|)|
|:-----------|--------:|----------:|-------:|------------------:|
|(Intercept) | 13.263| 0.526| 25.206| 0.000|
|WAR | 0.256| 0.023| 11.218| 0.000|
|age.start | -0.033| 0.022| -1.546| 0.123|
|exp | 0.396| 0.032| 12.492| 0.000|
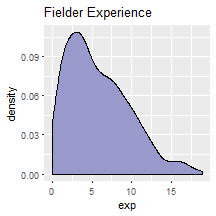
|exp2 | -0.014| 0.002| -6.876| 0.000|Here we can see that an additional unit of WAR can increase a player’s salary by almost 30% exp(beta_1)-1=0.291. We also see that experience increases a player’s salary by approximately 0.4 log points but also indicates diminishing returns to experience for the coefficient on beta_3 of -0.01 log points. Using the median fielder experience of 5 years, this suggests that a player’s salary is only predicted to increase by 29% exp(beta_2-2*beta_3)-1 with an additional year of experience. These variables are all significant at the 1% level. It appears beta_4 is negative which means players who start at an older age typically earn less over their career, however, this coefficient is somewhat insignificant. We see similar results for pitchers, however, using the pitcher - specific WAR score:
| | Estimate| Std. Error| t value| Pr(>|t|)|
|:-----------|--------:|----------:|-------:|------------------:|
|(Intercept) | 11.350| 0.439| 25.874| 0.000|
|WAR | 0.300| 0.031| 9.631| 0.000|
|age.start | 0.050| 0.017| 2.941| 0.003|
|exp | 0.399| 0.033| 12.228| 0.000|
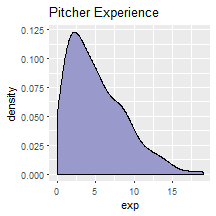
|exp2 | -0.014| 0.002| -6.170| 0.000|For pitchers, a unit increase in WAR will increase salary by 35% exp(beta_1)-1=0.3501. We see fairly similar estimates for beta_2 and beta_3 for pitchers compared to the fielder model. Using the same analysis for understating the effect of experience as before, a pitcher at the median pitcher experience of 4 will only receive a 21% boost in salary with an additional year of experience. Here, the Age Start variable appears to be significant and positive. This suggests that pitchers who start in the MLB at an older age earn higher salaries. This may be an adjustment made for pitchers who have more minor league experience. All variables in the pitching model are significant at the 1% level.
Finally, our analysis concludes by ranking players based on our Salary Arbitrage Index (SAI). This index will take the expected salary value from the previous models for a given player and compute a ratio of the expected salary to the earned salary in 2014. The idea here is to find the largest disparity between predicted salary and actual salary, which acts as an arbitrage estimate for team management to make effective bids on a free agent. For instance, Mike Trout is expected to earn $7,861,294 per year currently but only received $1,000,000. This means that Mike Trout will have an SAI of 7.86. This puts Mike Trout 3rd on our top 100 list, which makes sense because he should be earning almost 8 times of what he made in 2014. Anecdotally, we can see why. The corresponding SAI for the top 100 batters and top 100 pitchers are discussed in the following section.
Results
Tables 1 and 2 at the end of this document present our top 100 players lists for both fielders and pitchers. These tables provide the name of the player, years of experience, 2014 salary, predicted salary, and finally our SAI value. From the previous section, the ranking of players is based on this SAI value. These lists present “value” using SAI by determining which players outperform their current salaries. By valuing players in this fashion we have identified opportunities to sign players which are currently undervalued by the overall market. Given our stratified model by pitcher and fielder, we have created two separate top 100 lists.
Our lists are powerful tools for identifying undervalued players, particularly rookies. For example, Mike Trout just signed a 6-year contract with the Angels for $5,250,000 for 2015. Based on his median WAR value of 8.56 our model would predict his salary at $7,861,294.66, which is substantially higher than what Trout received indicating that the Angels made a very good deal with this contract. Other evidence pointing to the quality of our analysis would be the case of Josh Donaldson. Donaldson made $500,000 in 2014 with the Oakland Athletics and was signed to the Toronto Blue Jays in 2015 for $4.3 million. Based on his WAR score of 7.33 our model predicts his salary at $6,539,306.38. The Toronto Blue Jays have identified Josh Donaldson’s contribution to the team and acquired him under his true value; another very good deal. Finally, our number one pick in the top 100 for fielders is Rene Rivera. A 2014 salary of $506,400 and a WAR score of 3.19 give Rivera a predicted salary of $8,565,424.18. His 10 years of experience contribute to this high salary in conjunction with a good WAR score, and show that his $1.2 million dollar contract to the Tampa Bay Rays is extremely undervaluing his abilities. The results and tables show that our model should perform very well at identifying rookies who are almost ending their rookie contracts; our predictions assume that players’ salaries are adjusted on a yearly basis, which means that it will identify a large SAI for rookie players who provide wins to the team but are stuck in a similar contract with other average rookie players.
Conclusion
By taking advantage of an advanced sabermetric measurement like WAR, we are able to accurately value and compare fielders and pitchers. Our team has determined that “value” is best understood as opportunities to acquire players under their perceived market value. Our SAI identifies the largest disparities between current salary and our prediction. The results are two top 100 lists of the greatest arbitrage opportunities for both fielders and pitchers. An quick examination of some of the top players in our list seem to indicate the accuracy of our results. It is important to note there are some limitations of our approach. Pitchers are very hard to predict and our model seems to indicate that their performance has a lot to do with experience in addition to their WAR value. To further refine our model we would be interested in including contract length and time until free agency for players. These are both important factors when determining the viability of acquiring a player. With these in mind we still consider our model to be a fantastic resource to examining the value of players and determining the ideal compensation for their contribution to the team.
Authors
Alexander Knorr, Nick Vedder, Sebastian Kadamany
Table 1 Fielder Top 100 List
|Player_Name        | Experience|    WAR|Salary   |Predicted_Salary | SAI_Index|
|:------------------|----------:|------:|:--------|:----------------|---------:|
|Rene Rivera        |         10|  3.190|$506400  |$8565424.18      |    16.914|
|Josh Donaldson     |          4|  7.330|$500000  |$6539306.38      |    13.079|
|Mike Trout         |          3|  8.560|$1000000 |$7861294.66      |     7.861|
|John McDonald      |         15|  1.055|$850000  |$5406551.37      |     6.361|
|Xavier Nady        |         14| -0.640|$775000  |$3924801.95      |     5.064|
|Conor Gillaspie    |          6|  1.055|$512000  |$2506043         |     4.895|
|Ramon Santiago     |         12|  0.950|$1100000 |$5368881.66      |     4.881|
|Grady Sizemore     |         10| -0.040|$750000  |$3627780.05      |     4.837|
|Desmond Jennings   |          4|  3.230|$517000  |$2371018.21      |     4.586|
|Tony Gwynn         |          9|  1.000|$900000  |$4024671.17      |     4.472|
|Welington Castillo |          4|  3.140|$530000  |$2317095.71      |     4.372|
|Starling Marte     |          2|  5.230|$500000  |$2118833.4       |     4.238|
|Lorenzo Cain       |          4|  3.200|$546000  |$2275409.59      |     4.167|
|Alex Gonzalez      |         16|  0.170|$1100000 |$4577606.49      |     4.161|
|Donnie Murphy      |         10| -0.290|$825000  |$3403207.26      |     4.125|
|Manny Machado      |          2|  4.540|$519000  |$2030859.02      |     3.913|
|John Buck          |         10|  0.460|$1000000 |$3855281.05      |     3.855|
|James Loney        |          8|  1.430|$1000000 |$3840612.33      |     3.841|
|Kyle Seager        |          3|  3.870|$540100  |$2073367.39      |     3.839|
|Brayan Pena        |          9|  0.360|$875000  |$3304752.03      |     3.777|
|Jim Adduci         |          6|  0.160|$501000  |$1803015.23      |     3.599|
|Daniel Nava        |          4|  3.090|$556500  |$2000845.07      |     3.595|
|Todd Frazier       |          3|  4.110|$600000  |$2061715.37      |     3.436|
|Steve Pearce       |          7|  0.580|$700000  |$2402366.84      |     3.432|
|Reed Johnson       |         11| -0.050|$1000000 |$3383559.54      |     3.384|
|Wil Nieves         |         12| -0.355|$1125000 |$3596876.51      |     3.197|
|Francisco Cervelli |          6|  0.860|$700000  |$2229726.17      |     3.185|
|Jason Bartlett     |         10| -0.165|$1000000 |$3177822.77      |     3.178|
|Sam Fuld           |          7|  0.740|$800000  |$2420226.18      |     3.025|
|Juan Lagares       |          1|  5.470|$506636  |$1528948.19      |     3.018|
|Adam Eaton         |          3|  2.570|$511000  |$1537828.88      |     3.009|
|Shane Robinson     |          5|  0.660|$519000  |$1556505.55      |     2.999|
|Brian Dozier       |          2|  4.415|$540000  |$1608916.48      |     2.979|
|Lyle Overbay       |         13|  0.270|$1500000 |$4409390.31      |     2.940|
|Chris Stewart      |          8|  0.630|$1000000 |$2927536.48      |     2.928|
|Jose Molina        |         15|  0.830|$1750000 |$5104380.49      |     2.917|
|John Mayberry      |         11|  0.255|$1587500 |$4624309.95      |     2.913|
|Carlos Corporan    |          5|  0.570|$505300  |$1471007.06      |     2.911|
|Yan Gomes          |          2|  4.230|$550000  |$1586870.97      |     2.885|
|Tony Abreu         |          7| -0.120|$745000  |$2147940.22      |     2.883|
|Jarrod Dyson       |          4|  1.760|$530000  |$1522859.74      |     2.873|
|Brett Lawrie       |          3|  2.280|$516100  |$1476590.45      |     2.861|
|Chris Carter       |          4|  1.240|$510000  |$1425688.36      |     2.795|
|Kevin Frandsen     |          8| -0.025|$900000  |$2476228.05      |     2.751|
|A.J. Pollock       |          2|  3.690|$507000  |$1382280.27      |     2.726|
|Wilin Rosario      |          3|  2.080|$502000  |$1356791.2       |     2.703|
|Paul Konerko       |         17|  1.940|$2500000 |$6717465.98      |     2.687|
|Danny Espinosa     |          4|  1.290|$540580  |$1444026.34      |     2.671|
|Adam Rosales       |          6|  0.790|$750000  |$1980823.66      |     2.641|
|Brian Roberts      |         13|  0.790|$2000000 |$5207734.62      |     2.604|
|Marcell Ozuna      |          1|  4.520|$505000  |$1282398.75      |     2.539|
|Hank Conger        |          4|  0.720|$517500  |$1290756.45      |     2.494|
|Jack Hannahan      |          8|  0.240|$1000000 |$2478097.21      |     2.478|
|Brandon Crawford   |          3|  2.400|$560000  |$1377039.12      |     2.459|
|Robinson Chirinos  |          3|  2.360|$502232  |$1232738.24      |     2.455|
|Clint Barmes       |         11|  1.110|$2000000 |$4866712.03      |     2.433|
|Gerald Laird       |         11| -0.240|$1500000 |$3563829.25      |     2.376|
|Chris Gimenez      |          5| -0.080|$510000  |$1204794.93      |     2.362|
|DJ LeMahieu        |          3|  1.540|$501000  |$1181864.02      |     2.359|
|Craig Gentry       |          5|  2.860|$1145000 |$2641363.07      |     2.307|
|Nolan Arenado      |          1|  4.060|$500000  |$1140140.56      |     2.280|
|Nick Punto         |         13|  1.490|$2750000 |$6228105.79      |     2.265|
|Eric Sogard        |          4|  0.530|$510000  |$1149906.07      |     2.255|
|Paul Goldschmidt   |          3|  4.510|$1100000 |$2441871.4       |     2.220|
|Zack Cozart        |          3|  2.380|$600000  |$1324893.82      |     2.208|
|Elliot Johnson     |          6|  0.770|$930000  |$2037842.49      |     2.191|
|Brandon Guyer      |          3|  1.640|$501200  |$1096562.85      |     2.188|
|Lonnie Chisenhall  |          3|  1.315|$510800  |$1115809.92      |     2.184|
|Joaquin Arias      |          8| -0.370|$1150000 |$2506842.93      |     2.180|
|Andrew Romine      |          4|  0.340|$504000  |$1095394.18      |     2.173|
|Andrelton Simmons  |          2|  5.160|$1000000 |$2152142.86      |     2.152|
|Ramiro Pena        |          5|  0.390|$700000  |$1502183.28      |     2.146|
|Jeff Mathis        |          9|  0.090|$1500000 |$3189415.69      |     2.126|
|Christian Yelich   |          1|  3.650|$505000  |$1061669.2       |     2.102|
|Ryan Sweeney       |          8|  0.410|$1500000 |$3059955.24      |     2.040|
|Jordy Mercer       |          2|  2.750|$515500  |$1051239.15      |     2.039|
|Michael McKenry    |          4|  1.740|$750000  |$1515094.43      |     2.020|
|Scott Van Slyke    |          2|  2.650|$507500  |$1024708.9       |     2.019|
|Derek Norris       |          2|  2.320|$505000  |$1007064.17      |     1.994|
|Charlie Blackmon   |          3|  1.140|$501000  |$997868.78       |     1.992|
|Daric Barton       |          7|  0.320|$1250000 |$2485488.03      |     1.988|
|Chris Denorfia     |          9|  1.650|$2250000 |$4444235.13      |     1.975|
|Jean Segura        |          2|  2.325|$534000  |$1042694.77      |     1.953|
|Kole Calhoun       |          2|  2.335|$506000  |$977636.25       |     1.932|
|Tyler Flowers      |          5|  1.090|$950000  |$1796511.74      |     1.891|
|Brett Hayes        |          5| -0.375|$630000  |$1155340.84      |     1.834|
|Jayson Nix         |          6|  0.275|$950000  |$1736503.11      |     1.828|
|Pedro Florimon     |          3|  0.925|$517500  |$944509.31       |     1.825|
|Pedro Ciriaco      |          4| -0.275|$513500  |$936050.24       |     1.823|
|Corey Dickerson    |          1|  3.430|$500000  |$907678.34       |     1.815|
|Anthony Rizzo      |          3|  3.955|$1250000 |$2265698.57      |     1.813|
|Domonic Brown      |          4| -0.310|$550000  |$991982.03       |     1.804|
|Logan Forsythe     |          3|  0.810|$509700  |$917149.36       |     1.799|
|Jeff Baker         |          9| -0.070|$1600000 |$2863251.48      |     1.790|
|Michael Brantley   |          5|  2.520|$1500000 |$2677439.32      |     1.785|
|Casey McGehee      |          6|  0.755|$1100000 |$1963181.53      |     1.785|
|Hector Sanchez     |          3|  0.400|$512000  |$913189.46       |     1.784|
|Andrew Brown       |          4| -0.090|$538045  |$949054.27       |     1.764|
|Matt Dominguez     |          3|  0.325|$510100  |$895849.65       |     1.756|
|Travis Snider      |          6|  0.370|$1200000 |$2103519.47      |     1.753|
Table 2 Pitcher Top 100 List
|Player_Name        | Experience|    WAR|Salary   |Predicted_Salary | SAI_Index|
|:------------------|----------:|------:|:--------|:----------------|---------:|
|Joe Beimel         |         13|  0.955|$850000  |$6539928.09      |     7.694|
|Joe Saunders       |          9|  0.170|$500000  |$3512875.7       |     7.026|
|Scott Atchison     |         10|  0.450|$800000  |$5351626.86      |     6.690|
|Corey Kluber       |          3|  4.410|$514000  |$3240793.5       |     6.305|
|Aaron Harang       |         12|  0.930|$1000000 |$6142277.18      |     6.142|
|Jose Valverde      |         11|  0.590|$1000000 |$5366709.76      |     5.367|
|Dallas Keuchel     |          2|  5.030|$508700  |$2669934.26      |     5.249|
|Alex Cobb          |          3|  3.930|$516900  |$2539849.53      |     4.914|
|Chris Tillman      |          5|  2.430|$546000  |$2611428.75      |     4.783|
|Dellin Betances    |          3|  3.720|$502100  |$2384667.05      |     4.749|
|Chris Young        |         10|  1.050|$1250000 |$5518551.75      |     4.415|
|Dale Thayer        |          5|  0.735|$515800  |$2224797.29      |     4.313|
|Francisley Bueno   |          6| -0.040|$504500  |$2148621.6       |     4.259|
|Tanner Roark       |          1|  5.070|$506100  |$2087760.87      |     4.125|
|Yusmeiro Petit     |          8|  0.890|$845000  |$3183570.28      |     3.768|
|Adam Ottavino      |          4|  1.695|$502000  |$1846946.62      |     3.679|
|Scott Elbert       |          6|  0.530|$575000  |$1987594.56      |     3.457|
|Casey Fien         |          5|  0.515|$530000  |$1793562.16      |     3.384|
|Miguel Gonzalez    |          3|  2.030|$529000  |$1752273.81      |     3.312|
|Garrett Richards   |          3|  2.630|$520000  |$1719140.13      |     3.306|
|Pat Neshek         |          8|  0.210|$1000000 |$3167922.63      |     3.168|
|Carlos Torres      |          5|  0.320|$561875  |$1777959.69      |     3.164|
|Carlos Carrasco    |          5|  0.560|$504700  |$1565646.35      |     3.102|
|Lance Lynn         |          3|  2.200|$535000  |$1588096.79      |     2.968|
|Zach Duke          |          9| -0.635|$850000  |$2497153.47      |     2.938|
|Michael Pineda     |          3|  2.500|$538475  |$1573010.5       |     2.921|
|Anthony Varvaro    |          4|  0.840|$515000  |$1501784.61      |     2.916|
|Jason Frasor       |         10|  0.600|$1750000 |$5067376.43      |     2.896|
|David Huff         |          5| -0.005|$505000  |$1459781.19      |     2.891|
|Kevin Slowey       |          7|  0.130|$800000  |$2308942.8       |     2.886|
|Kelvin Herrera     |          3|  2.500|$522500  |$1496585.86      |     2.864|
|Donnie Veal        |          5| -0.015|$516000  |$1455405.26      |     2.821|
|Jake Arrieta       |          4|  0.700|$500000  |$1370011.37      |     2.740|
|Jesse Chavez       |          6|  0.415|$775000  |$2121259.65      |     2.737|
|Clayton Kershaw    |          6|  6.530|$4000000 |$10898339.54     |     2.725|
|Tom Koehler        |          2|  2.530|$515000  |$1392532.46      |     2.704|
|Brandon Kintzler   |          4|  0.465|$507000  |$1341882.12      |     2.647|
|Tony Watson        |          3|  1.360|$518500  |$1363377.08      |     2.629|
|Sam Deduno         |          4|  0.250|$520000  |$1322245.82      |     2.543|
|Juan Carlos Oviedo |          9|  0.600|$1500000 |$3802744.03      |     2.535|
|Jose Quintana      |          2|  4.465|$850000  |$2143900.89      |     2.522|
|Jean Machi         |          2|  1.520|$505000  |$1254987.4       |     2.485|
|Ryan Cook          |          3|  1.410|$505000  |$1252780.89      |     2.481|
|Julio Teheran      |          3|  3.580|$800000  |$1969174.95      |     2.461|
|J.C. Gutierrez     |          7| -0.200|$850000  |$2091159.15      |     2.460|
|Tom Wilhelmsen     |          3|  1.025|$528800  |$1295889.51      |     2.451|
|Oliver Perez       |         12|  0.390|$1750000 |$4279599.65      |     2.445|
|Chris Archer       |          2|  2.550|$500000  |$1206488.02      |     2.413|
|Carlos Marmol      |          8|  0.370|$1250000 |$3008678.13      |     2.407|
|Fernando Rodriguez |          5| -0.230|$600000  |$1434107.74      |     2.390|
|Tim Stauffer       |          9|  0.615|$1600000 |$3819907.31      |     2.387|
|Paul Maholm        |          9|  0.390|$1500000 |$3570399.85      |     2.380|
|Rex Brothers       |          3|  1.400|$502000  |$1188341.64      |     2.367|
|Evan Meek          |          6| -0.135|$800000  |$1890225.72      |     2.363|
|Henderson Alvarez  |          3|  1.860|$525400  |$1234971.98      |     2.351|
|Hector Santiago    |          3|  1.550|$530000  |$1243078.71      |     2.345|
|Dustin McGowan     |          9|  0.280|$1500000 |$3454417.51      |     2.303|
|Wade Miley         |          3|  1.260|$523500  |$1197616.6       |     2.288|
|Michael Kirkman    |          4|  0.290|$504576  |$1152490.97      |     2.284|
|Brad Lincoln       |          4| -0.025|$512300  |$1158316.24      |     2.261|
|Danny Farquhar     |          3|  1.120|$510800  |$1148323.67      |     2.248|
|Alex Wood          |          1|  3.650|$506250  |$1116910.19      |     2.206|
|Zach Britton       |          3|  1.280|$521500  |$1146292.54      |     2.198|
|Cesar Ramos        |          5|  0.115|$750000  |$1590609.6       |     2.121|
|Eric O'Flaherty    |          8|  0.870|$1500000 |$3164512.39      |     2.110|
|Jeanmar Gomez      |          4|  0.230|$514500  |$1076922.92      |     2.093|
|Alfredo Simon      |          6|  1.200|$1500000 |$3117695.69      |     2.078|
|Michael Kohn       |          4| -0.135|$515000  |$1066240.39      |     2.070|
|Fernando Abad      |          4| -0.070|$525900  |$1087251.38      |     2.067|
|Jamey Wright       |         18|  0.020|$1800000 |$3712233.5       |     2.062|
|Shelby Miller      |          2|  2.490|$521000  |$1072605.74      |     2.059|
|Drew Smyly         |          2|  2.150|$520000  |$1069966.5       |     2.058|
|Tommy Milone       |          3|  0.810|$510000  |$1046275.05      |     2.052|
|Chris Capuano      |         11|  0.250|$2250000 |$4610501.99      |     2.049|
|Sonny Gray         |          1|  3.170|$502500  |$1016400.42      |     2.023|
|Ryan Mattheus      |          3|  0.260|$520000  |$1029972.62      |     1.981|
|Jenrry Mejia       |          4|  0.335|$509675  |$1006038.89      |     1.974|
|Blake Wood         |          4| -0.030|$560000  |$1100386.49      |     1.965|
|Nathan Eovaldi     |          3|  1.205|$517000  |$1014511.18      |     1.962|
|Brandon Gomes      |          3|  0.310|$507800  |$994751.95       |     1.959|
|Yordano Ventura    |          1|  3.210|$500500  |$978701.23       |     1.955|
|Steve Delabar      |          3|  0.190|$515900  |$1008553.48      |     1.955|
|Jeremy Jeffress    |          4| -0.050|$507600  |$990096.75       |     1.951|
|Lucas Harrell      |          4| -0.560|$509700  |$986444.67       |     1.935|
|Neal Cotts         |         11|  0.140|$2200000 |$4244008.05      |     1.929|
|Bruce Chen         |         16|  0.975|$3000000 |$5670462.4       |     1.890|
|Matt Shoemaker     |          1|  2.430|$500500  |$945087.57       |     1.888|
|Jeff Locke         |          3|  0.715|$513000  |$967452.36       |     1.886|
|A.J. Ramos         |          2|  1.435|$510000  |$953689.41       |     1.870|
|Dane De La Rosa    |          3| -0.130|$515000  |$962956.46       |     1.870|
|Randy Choate       |         14|  0.350|$3000000 |$5607101.95      |     1.869|
|David Carpenter    |          4| -0.380|$532500  |$990630.1        |     1.860|
|Troy Patton        |          7|  0.530|$1275000 |$2356709.41      |     1.848|
|Shawn Tolleson     |          2|  1.500|$502082  |$925234.48       |     1.843|
|Jordan Lyles       |          3|  1.060|$502000  |$924105.28       |     1.841|
|Bryan Shaw         |          3|  0.680|$529500  |$957340.02       |     1.808|
|LaTroy Hawkins     |         19|  0.520|$2250000 |$4062712.68      |     1.806|
|Cody Allen         |          2|  1.685|$515400  |$930555.99       |     1.806|
|Brad Brach         |          3|  0.200|$509500  |$915678.01       |     1.797|
|Chris Sale         |          4|  6.250|$3500000 |$6243883.38      |     1.784|